Actionable Insights in Seconds
Identify Trends | Adjust Accordingly | Maximize Data
Use your data to take action. Empower your team to easily create modern, real-time visualizations with the QT9™ ERP Business Intelligence (BI) tool.

QT9 ERP Business Intelligence enables you to analyze data in meaningful ways, making it easier to make correlations, identify trends, detect opportunities and risks, and optimize strategies.
Drag-&-drop functionality makes it easy to create new views of your data.
Make better business decisions using data-driven analytics.
Save time and ensure you are not over- or under-producing.
Create reports and translate the data from a single source of truth.
Identify Trends | Adjust Accordingly | Maximize Data

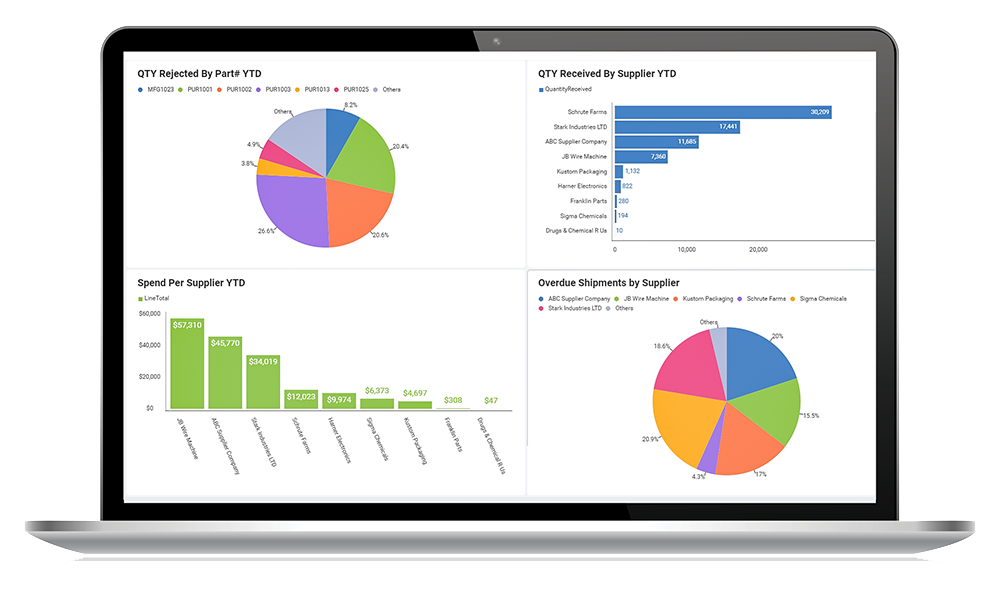
Imagine being able to graphically visualize your supplier on-time performance in conjunction with material usage rates; or your sales by items, customers, quarters and months; or even scrap rates and machine usage -- all in one dashboard. With Business Intelligence Software, you can turn complex data into clear, actionable insights.
Create smart dashboards for views on the fly.
Generate custom reports quickly.
Share dashboards and reports with a few simple clicks.
Simplify data analysis with intuitive drag-and-drop features.